

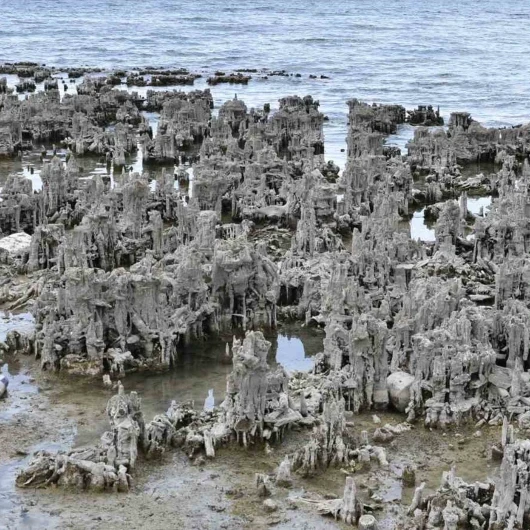
VAN — A comprehensive scientific study examining the 35-year trajectory of Van Lake’s shoreline and surface area has revealed that the iconic water body is experiencing a pronounced and accelerating contraction. Conducted under the framework of the "My Future is Hidden in Van Lake: Underwater Technologies and Career Route for 14-18 Age Youth" project, the research highlights a dramatic loss in water volume, with the vast majority of the recession taking place over the last decade.
The project itself is organized by the Anatolian Underwater Research and Sports Association (ASAD) with crucial support from the General Directorate of Relations with Civil Society under the Turkish Ministry of Interior. By leveraging advanced satellite imagery, remote sensing, and Geographic Information Systems (GIS), researchers were able to construct a multi-decade timeline of the lake’s physical boundaries. The geospatial analysis was spearheaded by ASAD member and mapping scientist Prof. Dr. Murat Yakar, who compared high-resolution satellite data from 1990, 2015, and 2025 to calculate the lake’s shifting surface areas across different epochs.
The findings point to a stable long-term baseline that began to deteriorate sharply in recent years. While the lake’s recession was historically slow and almost negligible, the analytical breakdown shows that the pace of environmental stress has intensified significantly over the past ten years, sounding an alarm bell for environmentalists, hydrologists, and regional stakeholders alike.
35 Years of Environmental Shifts Tracked Through Satellite Imagery
To accurately map and measure the changing boundaries of Van Lake, Prof. Dr. Murat Yakar and his research team deployed modern remote sensing methodologies combined with robust GIS-based analyses. This technological approach allows scientists to monitor massive geographical features over long spans of time without relying solely on ground-level observations, which can often be limited by topography and accessibility.
The core of the methodology relied on multi-spectral imagery captured by NASA and the U.S. Geological Survey’s Landsat satellite missions, specifically utilizing data from Landsat 4-5 and Landsat 8-9 systems. From these space-borne captures, the researchers calculated the Normalized Difference Water Index (NDWI), a widely recognized and scientifically robust index designed to accentuate open water features in satellite data.
Following the index calculation, a thresholding technique was applied to the datasets to establish a clear mathematical boundary between open water and surrounding landmasses. Once isolated, these water bodies were transformed into polygon vector data within the GIS environment, enabling precise calculations of the lake’s surface area for each targeted year. This meticulous digital processing allowed the team to overlay historical and contemporary boundary lines onto a unified geographical plane, creating a high-precision spatial comparison of the lake’s recession across different sectors.
Twenty-Five Years of Stability Followed by a Decade of Rapid Loss
The analytical results provide a sobering numerical account of Van Lake’s recent history. According to the spatial data, the total surface area of the lake was calculated at approximately 3,577 square kilometers in 1990. Over the subsequent quarter-century, that number remained remarkably stable, dipping only slightly to 3,573 square kilometers by 2015.
However, the data for the decade leading up to 2025 reveals a striking departure from this historical stability. By 2025, the lake’s total surface area had dropped to roughly 3,546 square kilometers.
When breaking down the chronology, the stark contrast in timelines becomes immediately apparent. Between 1990 and 2015—a span of 25 years—the lake lost a modest 4 square kilometers of its surface area. In stark contrast, during the mere 10-year period between 2015 and 2025, the lake shrank by a staggering 27 square kilometers.
In total, the lake has lost approximately 31 square kilometers of its surface area over the entire 35-year observation window. Most critically, the data shows that roughly 87 percent of this total historical loss occurred exclusively within the last ten years, underscoring an alarming acceleration in the rate at which Van Lake is retreating from its former shores.
Mapping the Shrinking Shoreline Across Generations
To visualize these hydrological shifts, the research team successfully compiled a comparative mapping interface that superimposes the shoreline boundaries of 1990, 2015, and 2025 onto a single map. This spatial visualization allows researchers, students, and public authorities to observe precisely where the land has advanced and where the water has retreated across different geographical segments of the vast basin.
Prof. Dr. Murat Yakar emphasized that the marriage of satellite imagery and modern GIS technology provides an indispensable toolkit for tracking the long-term health of large enclosed water bodies. He noted that comparative analyses of multi-temporal satellite data offer foundational baselines for detecting environmental shifts and planning future scientific inquiries.
"Using satellite imagery, we compared the shoreline positions and water surface areas of Van Lake for the years 1990, 2015, and 2025," Prof. Dr. Yakar stated, summarizing the scope of the investigation. He reiterated that while the 35-year timeline shows a cumulative loss of 31 square kilometers, the concentration of this shrinkage within the post-2015 era demands rigorous attention.
Yakar further explained the technical framework of the project, detailing how Landsat 4-5 and Landsat 8-9 datasets were processed using NDWI calculations and thresholding methods to separate water from land before conversion into GIS polygons. He highlighted that while the initial 25-year period saw a minimal reduction of 4 square kilometers, the subsequent decade witnessed an exponential leap to 27 square kilometers of lost surface area.
While acknowledging that fluctuations in lake surface areas are naturally driven by a complex matrix of meteorological and hydrological factors—including precipitation rates, evaporation, regional temperatures, and changing climate patterns—Yakar stressed that understanding the root causes requires more than isolated snapshots. He pointed out that identifying the specific drivers of this retreat will necessitate comprehensive, long-term studies supported by sustained meteorological data, continuous water level measurements, and broader hydrological monitoring. Ultimately, the results underscore the vital necessity of regular, science-based monitoring protocols to support the sustainable management of regional water resources in the face of ongoing environmental challenges.
Van Lake Must Be Monitored Scientifically, Says ASAD Representative
Echoing the urgency of the findings, ASAD Bitlis Representative Assoc. Prof. Dr. Cihan Önen underscored the importance of the ongoing civil society initiative and the data it continues to produce. Operating under the auspices of the Ministry of Interior’s Department of Relations with Civil Society through the "My Future is Hidden in Van Lake" project, Önen and his colleagues have been actively working to measure and evaluate the physical changes taking place across the basin.
Önen stressed that the shifting shoreline and diminishing surface area of Van Lake must be continuously monitored using robust scientific methodologies rather than anecdotal observations. Protecting Van Lake, he noted, is not merely an ecological priority, but a profound generational duty to preserve a shared natural heritage for future generations. As regional data continues to highlight the accelerating pace of the lake’s recession, local stakeholders and scientific networks hope that these empirical findings will serve as a foundational guide for proactive conservation policies and sustainable water resource management in eastern Turkey.